Car Counting And Air Quality
Counting cars and air quality
I’ve been interested in open data for a while, and Newcastle City Council has combined forces with the University here to do some interesting things.
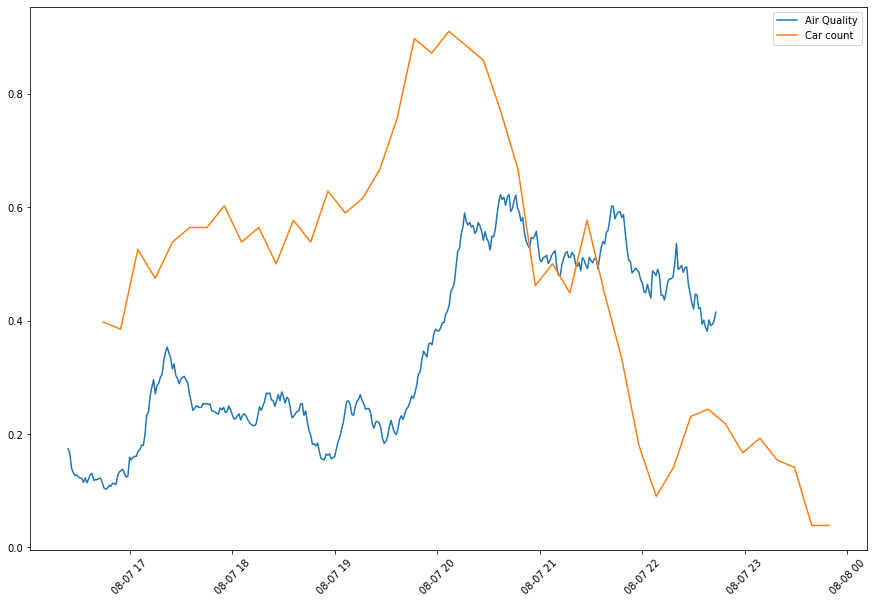
Specifically, there’s an air quality monitor and a cctv traffic camera near a local primary school. This got me wondering: is it possible to see a relation between changes in air quality and the number of cars on the road.
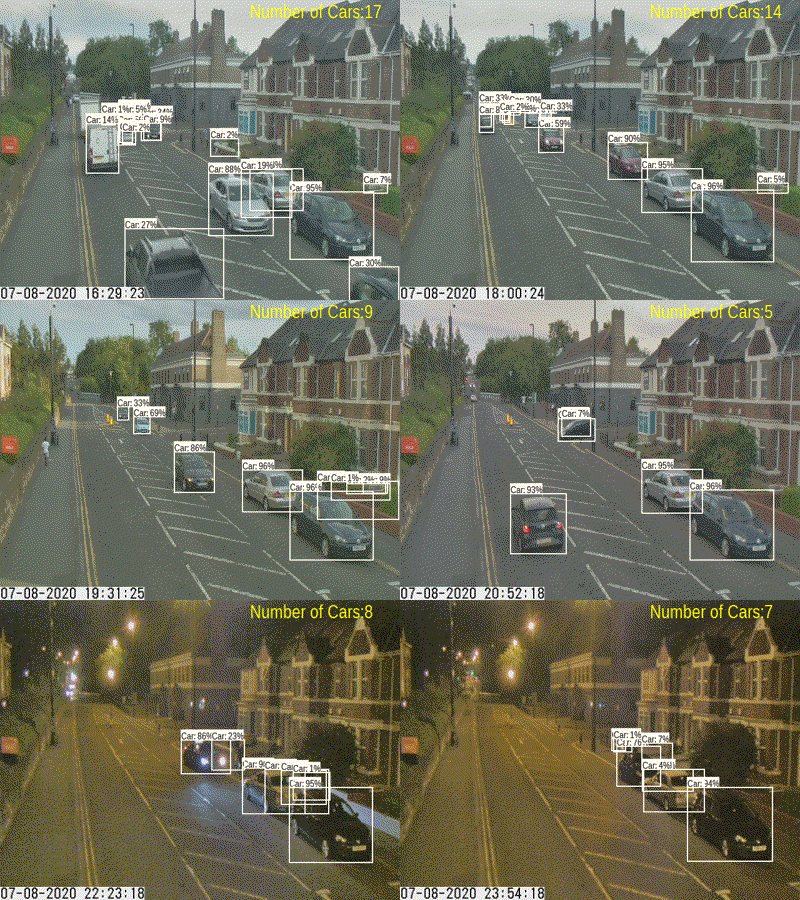
The problem is not straightforward, and of course correlation doesn’t imply causation, but the results are quite nice. Along the way, I learnt a bit about object detection using the FasteR-CNN model, pretrained on the COCOv3 dataset.
Here’s a plot of the two results over time:

and here’s a GIF (which I generated using gifsicle:

I used google colab to do the heavy lifting, you can see the notebook here
The script to download images from the cctv api is in this repo. I had trouble setting up the listener, so ended up just checking the api for a new update every so often.