How To Catch An Alligator
Post script: This analysis was originally created in 2017, some 6 months before I actually got a job as a data scientist. This post is part of clearing a backlog of projects that I worked on before getting my first break as a Data Scientist. My approach is to publish as soon as it’s not embarrassing - but there’s still plenty of room for improvement
Getting strategic in the Statewide Nuisance Alligator Program (SNAP)
Preamble
Florida Fish and Wildlife Conservation Commission’s Statewide Alligator Harvest data between 2000 and 2016 is available at: http://myfwc.com/wildlifehabitats/managed/alligator/harvest/data-export
I was first made aware of the dataset by Jeremy Singer-Vine, through his data is plural newsletter of curious and interesting datasets: https://tinyletter.com/data-is-plural
Extra shoutout to LaTosha from FWC for your help in trying to link the data with some GISdata. I’d love to map some of this data out, but will leave that to the interested reader
Introduction
The analysis is set out in three parts:
- Clean the data (including converting the Carcass Size measurements to metric - sorry ‘bout that US readers!)
- Explore the time-related fields to identify ‘a good time to go hunting’
- Explore the location-related fields to identify ‘a good place to go hunting’
(Step 4. would be to fly out to Florida and test out my theories… #sponsorme!)
import seaborn as sns
import pandas as pd
import numpy as np
from copy import deepcopy
import matplotlib.pyplot as plt
import matplotlib.pylab as pylab
import re
pylab.rcParams['figure.figsize'] = 30, 20
%matplotlib inline
raw_data = pd.read_csv('FWCAlligatorHarvestData.csv')
clean_data = deepcopy(raw_data)
raw_data.loc[1:20]
| Year | Area Number | Area Name | Carcass Size | Harvest Date | Location | |
|---|---|---|---|---|---|---|
| 1 | 2000 | 101 | LAKE PIERCE | 9 ft. 0 in. | 10-02-2000 | NaN |
| 2 | 2000 | 101 | LAKE PIERCE | 8 ft. 10 in. | 10-06-2000 | NaN |
| 3 | 2000 | 101 | LAKE PIERCE | 8 ft. 0 in. | 09-25-2000 | NaN |
| 4 | 2000 | 101 | LAKE PIERCE | 8 ft. 0 in. | 10-07-2000 | NaN |
| 5 | 2000 | 101 | LAKE PIERCE | 8 ft. 0 in. | 09-22-2000 | NaN |
| 6 | 2000 | 101 | LAKE PIERCE | 7 ft. 2 in. | 09-21-2000 | NaN |
| 7 | 2000 | 101 | LAKE PIERCE | 7 ft. 1 in. | 09-21-2000 | NaN |
| 8 | 2000 | 101 | LAKE PIERCE | 6 ft. 11 in. | 09-25-2000 | NaN |
| 9 | 2000 | 101 | LAKE PIERCE | 6 ft. 7 in. | 09-25-2000 | NaN |
| 10 | 2000 | 101 | LAKE PIERCE | 6 ft. 6 in. | 09-15-2000 | NaN |
| 11 | 2000 | 101 | LAKE PIERCE | 6 ft. 3 in. | 10-07-2000 | NaN |
| 12 | 2000 | 102 | LAKE MARIAN | 12 ft. 7 in. | 09-04-2000 | NaN |
| 13 | 2000 | 102 | LAKE MARIAN | 12 ft. 3 in. | 09-10-2000 | NaN |
| 14 | 2000 | 102 | LAKE MARIAN | 12 ft. 3 in. | 09-03-2000 | NaN |
| 15 | 2000 | 102 | LAKE MARIAN | 12 ft. 2 in. | 09-25-2000 | NaN |
| 16 | 2000 | 102 | LAKE MARIAN | 12 ft. 0 in. | 09-27-2000 | NaN |
| 17 | 2000 | 102 | LAKE MARIAN | 11 ft. 10 in. | 09-09-2000 | NaN |
| 18 | 2000 | 102 | LAKE MARIAN | 11 ft. 7 in. | 09-10-2000 | NaN |
| 19 | 2000 | 102 | LAKE MARIAN | 11 ft. 1 in. | 10-07-2000 | NaN |
| 20 | 2000 | 102 | LAKE MARIAN | 11 ft. 1 in. | 10-07-2000 | NaN |
raw_data.shape
(87182, 6)
Cleaning and preprocessing
Nothing revolutionary here:
- Convert lengths from imperial strings to metric floats
- look into null data and fill it where possible, or drop it
def metric_size_converter(size):
    ## size is a string, with the measurements separated by spaces
    ## split this string to pull out the actual measurements

    string_list = size.split()
    feet = float(string_list[0])
    inches = float(string_list[2])

    ## convert feet and inches into metres
    metres = (feet*12 + inches)*2.54/100

    return metres
clean_data['Carcass Size'] = clean_data['Carcass Size'].apply(lambda x: metric_size_converter(x))
clean_data.head()
| Year | Area Number | Area Name | Carcass Size | Harvest Date | Location | |
|---|---|---|---|---|---|---|
| 0 | 2000 | 101 | LAKE PIERCE | 3.4798 | 09-22-2000 | NaN |
| 1 | 2000 | 101 | LAKE PIERCE | 2.7432 | 10-02-2000 | NaN |
| 2 | 2000 | 101 | LAKE PIERCE | 2.6924 | 10-06-2000 | NaN |
| 3 | 2000 | 101 | LAKE PIERCE | 2.4384 | 09-25-2000 | NaN |
| 4 | 2000 | 101 | LAKE PIERCE | 2.4384 | 10-07-2000 | NaN |
clean_data['Harvest_Date'] = pd.to_datetime(clean_data['Harvest Date'])
clean_data.head()
| Year | Area Number | Area Name | Carcass Size | Harvest Date | Location | Harvest_Date | |
|---|---|---|---|---|---|---|---|
| 0 | 2000 | 101 | LAKE PIERCE | 3.4798 | 09-22-2000 | NaN | 2000-09-22 |
| 1 | 2000 | 101 | LAKE PIERCE | 2.7432 | 10-02-2000 | NaN | 2000-10-02 |
| 2 | 2000 | 101 | LAKE PIERCE | 2.6924 | 10-06-2000 | NaN | 2000-10-06 |
| 3 | 2000 | 101 | LAKE PIERCE | 2.4384 | 09-25-2000 | NaN | 2000-09-25 |
| 4 | 2000 | 101 | LAKE PIERCE | 2.4384 | 10-07-2000 | NaN | 2000-10-07 |
# check for any null dates

len(clean_data[pd.isnull(clean_data['Harvest_Date'])])
264
clean_data[pd.isnull(clean_data['Harvest_Date'])].shape

## looks like there's no date for some catches, but there is a year
(264, 12)
# Still useful to have the year, but create a filter to avoid any Nan issues

has_date = pd.notnull(clean_data['Harvest_Date'])
has_date.shape
(87145,)
## Let's check that the year has still been recorded correctly

clean_data['Year'] = clean_data[has_date]['Harvest_Date'].apply(lambda x: x.year)

bad_date = clean_data[has_date][clean_data[has_date]['Year'] != clean_data[has_date]['Year']]

len(bad_date)
0
Always worth checking for internal consistency…
clean_data = clean_data.drop(bad_date.index, axis = 0)
clean_data.loc[~has_date,'Year'] = clean_data.loc[~has_date,'Year']
clean_data.shape
(87182, 7)
clean_data.loc[has_date,'Month'] = clean_data.loc[has_date,'Harvest_Date'].apply(lambda x: x.month)
clean_data.loc[has_date,'Day'] = clean_data.loc[has_date,'Harvest_Date'].apply(lambda x: x.day)
len(clean_data.loc[~has_date,'Month'])
264
When should I go hunting?
## How many distinct weeks do we have data for?

weeks = pd.DataFrame({'Year': clean_data.Year,'week':clean_data.Harvest_Date.apply(lambda x:x.week)})

weeks = weeks.drop_duplicates()

len(weeks)
195
import calendar as cal
days = list(cal.day_abbr)
clean_data['DayofWeek'] = clean_data['Harvest_Date'].apply(lambda x: x.dayofweek)
clean_data.loc[has_date,'Dayname'] = clean_data.loc[has_date,'DayofWeek'].apply(lambda x: days[int(x)])
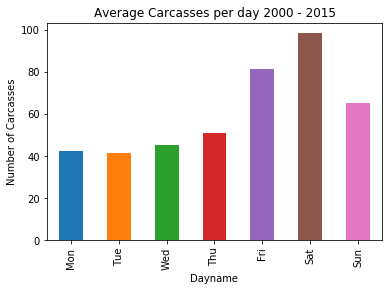
day_count = clean_data.groupby('Dayname')['Carcass Size'].count()/(204)
day_count.reindex(days).plot(kind='bar').set(ylabel = 'Number of Carcasses', title = 'Average Carcasses per day 2000 - 2015')
[Text(0, 0.5, 'Number of Carcasses'),
 Text(0.5, 1.0, 'Average Carcasses per day 2000 - 2015')]
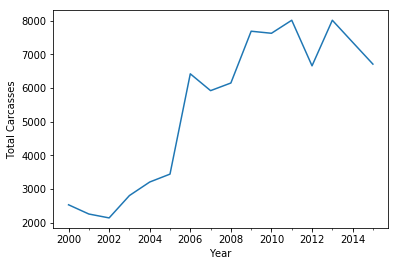
## Time series of number of catches over years

date_indexed_df = clean_data.set_index(pd.DatetimeIndex(clean_data['Harvest_Date']))

df_by_year = date_indexed_df.groupby(pd.TimeGrouper(freq='A'))

yearplot = df_by_year['Carcass Size'].count().plot(kind='line')

yearplot.set(xlabel='Year',ylabel='Total Carcasses')
/home/tms/anaconda3/lib/python3.7/site-packages/ipykernel_launcher.py:5: FutureWarning: pd.TimeGrouper is deprecated and will be removed; Please use pd.Grouper(freq=...)
  """


[Text(0, 0.5, 'Total Carcasses'), Text(0.5, 0, 'Year')]
fig, axarray = plt.subplots(4,4,figsize = (12,12), sharey = True)

row = col = 0
for key, grp in df_by_year:
    if col == 4:
        row += 1
        col = 0

    grp.groupby(pd.Grouper(freq='D'))['Carcass Size'].count().plot(ax = axarray[row,col],kind='line')
    col+=1

plt.tight_layout(pad=3)
plt.suptitle('Daily Number of Carcasses by Year', size = 12)
plt.show()
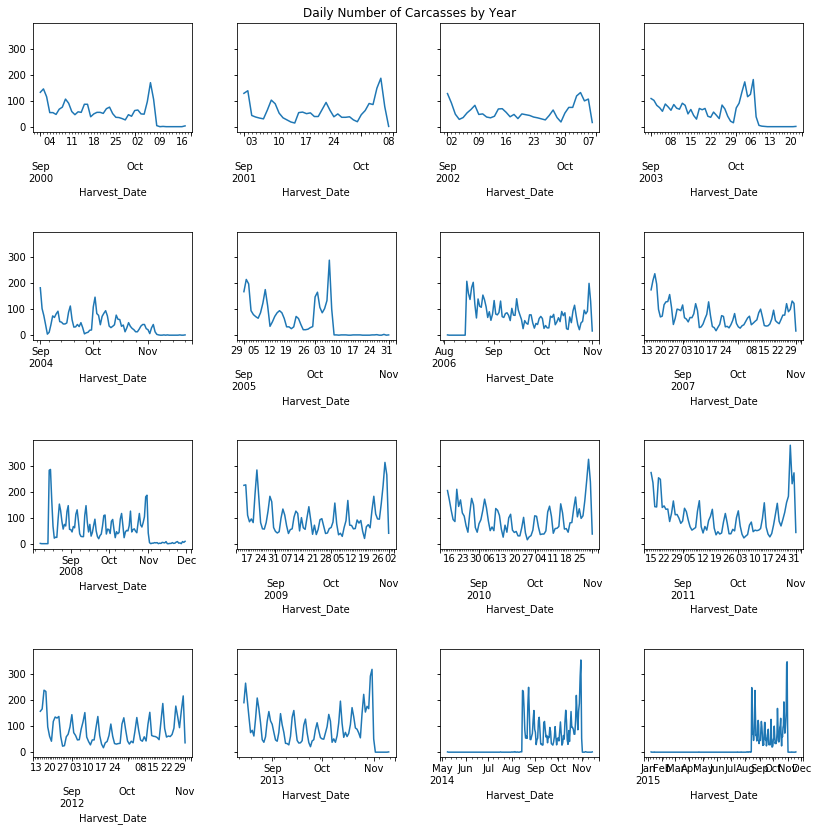
Observations
- There is a predictable weekday/weekend cycle
- There is usually a peak in the harvest towards the end of the season, which in recent years has been the end of November (although in 2014 and 2015 catches took place outside of the September-November window)
- The total harvest has gone up dramatically year on year
So, without a time machine to take us back to the quiet times around 2000-2005, the best time looks like a Monday towards the end of September.
Where should I go hunting?
## Each entry is marked with one or both of an Area Name and a Location e.g.

clean_data.iloc[87132]
Year                           2015
Area Number                     866
Area Name             WALTON COUNTY
Carcass Size                 2.6924
Harvest Date             08-23-2015
Location                 KINGS LAKE
Harvest_Date    2015-08-23 00:00:00
Month                             8
Day                              23
DayofWeek                         6
Dayname                         Sun
Name: 87132, dtype: object
print('There are %i distinct areas, and %i distinct locations' %(len(clean_data['Area Name'].unique()),len(clean_data['Location'].unique())))
There are 166 distinct areas, and 3577 distinct locations
## How many entries don't have an Area Name? 101

Area_Unknown = clean_data['Area Name'].isnull()

print(Area_Unknown.sum())

## How many entries don't have a location? 71096

Location_Unknown = clean_data['Location'].isnull()

print(Location_Unknown.sum())

## How many don't have an area or a location? 99

Location_Unknown[Area_Unknown].sum()

## Can we infer the area from the location (when there's a location but no area?)

clean_data[Area_Unknown][~Location_Unknown]
101
71145


/home/tms/anaconda3/lib/python3.7/site-packages/ipykernel_launcher.py:19: UserWarning: Boolean Series key will be reindexed to match DataFrame index.
| Year | Area Number | Area Name | Carcass Size | Harvest Date | Location | Harvest_Date | Month | Day | DayofWeek | Dayname | |
|---|---|---|---|---|---|---|---|---|---|---|---|
| 17244 | 2006.0 | 406 | NaN | 2.8448 | 10-28-2006 | STA-5 (406) | 2006-10-28 | 10.0 | 28.0 | 5.0 | Sat |
| 17272 | 2006.0 | 406 | NaN | 2.4130 | 09-08-2006 | STA 5 (406) | 2006-09-08 | 9.0 | 8.0 | 4.0 | Fri |
## Looks like they're all from Area 406, which is sometimes called STA-5,
## so let's just impute that and then drop any other unknown locations

clean_data.loc[clean_data['Area Number'] == 406,'Area Name'] = 'STA-5'
Area_Unknown = clean_data['Area Name'].isnull()

clean_data = clean_data.drop(clean_data[Area_Unknown].index)
Sub-Areas
Some of our areas have a parentheses-enclosed sub-area, which may be useful to teases out the best place. If we just say ‘Take me to St. John’s River’, it’s better if we’re referring to somewhere specific along that 300 mile stretch…!
## Here are the specific sub areas

def sub_area_search(string):
    return re.search("\((.*?)\)",string,re.I)

sub_area_col = clean_data['Area Name'].apply(lambda x: sub_area_search(x).group(1) if sub_area_search(x) else None)

sub_area_filt = clean_data['Area Name'].apply(lambda x: True if sub_area_search(x) else False)

sub_area_col[sub_area_filt].unique()
array(['POOL A', 'POOL C', 'WEST', 'SOUTH', 'NORTH', 'EAST',
       "LAKE HELL N' BLAZES", 'LAKE POINSETT', 'PUZZLE LAKE', 'WELAKA',
       'PALATKA SOUTH', 'WCAs 2A & 2B', 'WCAs 3A & 3B', 'BROADMOOR UNIT',
       'GOODWIN UNIT', 'WCA 2', 'WCA 3', 'PALATKA', 'POOL E'],
      dtype=object)
clean_data[sub_area_filt].groupby('Area Name').Location.agg({'Distinct Locations' :  pd.Series.nunique,
                    'Total Harvest' : pd.Series.count})
/home/tms/anaconda3/lib/python3.7/site-packages/ipykernel_launcher.py:2: FutureWarning: using a dict on a Series for aggregation
is deprecated and will be removed in a future version
| Distinct Locations | Total Harvest | |
|---|---|---|
| Area Name | ||
| EVERGLADES & FRANCIS S. TAYLOR WMA (WCA 2) | 1 | 2 |
| EVERGLADES & FRANCIS S. TAYLOR WMA (WCA 3) | 7 | 9 |
| EVERGLADES & FRANCIS S. TAYLOR WMA (WCAs 2A & 2B) | 0 | 0 |
| EVERGLADES & FRANCIS S. TAYLOR WMA (WCAs 3A & 3B) | 0 | 0 |
| EVERGLADES WMA (WCA 2) | 9 | 13 |
| EVERGLADES WMA (WCA 3) | 26 | 42 |
| KISSIMMEE RIVER (POOL A) | 13 | 26 |
| KISSIMMEE RIVER (POOL C) | 0 | 0 |
| KISSIMMEE RIVER (POOL E) | 8 | 10 |
| LAKE OKEECHOBEE (EAST) | 24 | 48 |
| LAKE OKEECHOBEE (NORTH) | 40 | 80 |
| LAKE OKEECHOBEE (SOUTH) | 80 | 231 |
| LAKE OKEECHOBEE (WEST) | 84 | 174 |
| ST. JOHNS RIVER (LAKE HELL N' BLAZES) | 44 | 92 |
| ST. JOHNS RIVER (LAKE POINSETT) | 67 | 314 |
| ST. JOHNS RIVER (PALATKA SOUTH) | 1 | 1 |
| ST. JOHNS RIVER (PALATKA) | 4 | 5 |
| ST. JOHNS RIVER (PUZZLE LAKE) | 24 | 102 |
| ST. JOHNS RIVER (WELAKA) | 20 | 43 |
| T.M. GOODWIN WMA (BROADMOOR UNIT) | 1 | 1 |
| T.M. GOODWIN WMA (GOODWIN UNIT) | 0 | 0 |
Let's take a look at the range of locations for a couple of these - should we just replace the area with the (sub area)?
clean_data[sub_area_filt][clean_data['Area Name'] == 'ST. JOHNS RIVER (WELAKA)'].groupby('Location').Year.count()
/home/tms/anaconda3/lib/python3.7/site-packages/ipykernel_launcher.py:1: UserWarning: Boolean Series key will be reindexed to match DataFrame index.
  """Entry point for launching an IPython kernel.


Location
ACCROSS FROM WEL                  1
FL                                2
LITTLE LAKE GEORGE                2
NE SIDE OF LITTLE LAKE GEORGE     2
PRIVATE PROPERTY                  4
SEVEN SISTERS IS                  1
SPORTSMANS HARBOR AREA            1
ST JOHNS                          1
ST JOHNS RIVER                    2
ST JOHNS RIVER SHELL HABOR        1
ST JOHNS RIVER-WALAKA             1
ST JOHNS WELKA                    2
ST. JOHNS RIVER                   1
St. Johns River                   1
TURKEY ISLAND COVE                1
WALAKA                            1
WELAKA                           14
WELATKA 506                       2
WELEKA                            1
WELKA                             2
Name: Year, dtype: int64
So we'll just call it WELAKA as location - too much detail since they'll all have the same area code. Ultimately go back to the area code.
Also, looks like in most cases the location is unknown anyway
clean_data[clean_data['Area Name'] == 'ST. JOHNS RIVER (LAKE POINSETT)' ].groupby('Location').Year.count()
Location
502                                 6
502 WASHINGTON                      1
BREVARD                             1
BREVARD COUNTY                      1
Brevard                             1
FL                                  1
LAKE  POINCETT                      1
LAKE  POINTSETTE                    1
LAKE PAINSETTE                      1
LAKE POINSET                        6
LAKE POINSETE                       1
LAKE POINSETT                      56
LAKE POINSETT NORTH                 1
LAKE POINSETTE                     15
LAKE POINTSETT                      6
LAKE PUINSATTA                      3
LAKE WASH./ POINSETT                1
LAKE WASHING 502                    1
LAKE WASHINGTON                    72
LAKE WASHINGTON 502                 1
LAKE WASHINGTON DAM                 1
LAKE WASHINGTON/POINSETT            1
LAKE WINDER                        18
LAKE WINER                          1
LAKEPOINSETT                        1
LK. WASHINGTON                      1
Lake Harris                         1
Lake Poinsett                       6
Lake Poinsette                      3
Lake poinsett                       1
                                   ..
POINSETTA                           2
POINSETTE                           4
POINTSET                            2
POINTSETT                           4
PONSETT                             1
SAINT JOHNS RIVER                   1
SOUTH END OF LAKE WASHINGTON        2
ST JOHNS                            2
ST JOHNS IN BREVARD (               1
ST JOHNS NORTH RIVER                1
ST JOHNS RIVER                     13
ST JOHNS RIVER LAKE POINSETT        1
ST JOHNS RIVER LAKE POINSETTE       3
ST JOHNS RIVER LAKE WINDER          2
ST. JOHN IN BREVARD                 1
ST. JOHNS RIVER                     7
ST. JOHNS RIVER (LAKE POINSETT)     1
ST.JOHNS                            2
UPPER ST. JOHN                      1
UPPER ST. JOHNS                     2
WASHINGTN                           1
WASHINGTON                          5
WASHINGTON 502                      4
WASHINGTTON                         1
WASHINTON                           1
WINDER                              2
WINDSER                             1
lake Poinsette                      1
lake poinset                        2
lake poinsett                       1
Name: Year, Length: 67, dtype: int64
Again, loads of locations, but the main two are Lake Poinsett and Lake Washington.
What's strange is that these lakes aren't particularly near each other, so maybe the location is not actually that helpful.
What we'll do is use the location to help indicate if the carcass was from a lake, river etc., but when looking for specific places, we'll only use the area
## simple regex function to generate new area columns

def area_classifier(area_name, specified_area_type):
    try:
        if re.search(specified_area_type,area_name, re.I):
            return True
        else:
            return False
    except:
        return False
filtarea_names = ['River','Lake','County','WMA','Marsh','Pond', 'Unknown','Reservoir','^STA']
filt_area_dict = {}

for n in filtarea_names:
    filt_area_dict[n]=clean_data['Area Name'].apply(lambda x: area_classifier(x, n))


## Make these boolean filters rather than columns on the dataframe
## Start with locations where available then go on to areas
## Little River Lake is a Lake, not a river.
clean_data[filt_area_dict['WMA']]['Area Name'].unique()
array(['EVERGLADES WMA - 2', 'EVERGLADES WMA - 3', 'HOLEY LAND WMA',
       'GUANA RIVER WMA', 'OCALA WMA', 'THREE LAKES WMA',
       'EVERGLADES & FRANCIS S. TAYLOR WMA (WCAs 2A & 2B)',
       'EVERGLADES & FRANCIS S. TAYLOR WMA (WCAs 3A & 3B)',
       'T.M. GOODWIN WMA (BROADMOOR UNIT)',
       'T.M. GOODWIN WMA (GOODWIN UNIT)', 'EVERGLADES WMA (WCA 2)',
       'EVERGLADES WMA (WCA 3)', 'T.M. GOODWIN WMA GOODWIN UNIT)',
       'EVERGLADES & FRANCIS S. TAYLOR WMA (WCA 2)',
       'EVERGLADES & FRANCIS S. TAYLOR WMA (WCA 3)'], dtype=object)
filt_location_dict = {}
filtlocation_names = ['River','Lake','County','WMA','Marsh','Pond', 'Unknown','Swamp','Creek','Canal','Springs']

for n in filtlocation_names:

    filt_location_dict[n] = clean_data['Location'].apply(lambda x: area_classifier(x, n))
clean_data[filt_location_dict['Swamp']][filt_area_dict['Lake']]
/home/tms/anaconda3/lib/python3.7/site-packages/ipykernel_launcher.py:1: UserWarning: Boolean Series key will be reindexed to match DataFrame index.
  """Entry point for launching an IPython kernel.
| Year | Area Number | Area Name | Carcass Size | Harvest Date | Location | Harvest_Date | Month | Day | DayofWeek | Dayname | |
|---|---|---|---|---|---|---|---|---|---|---|---|
| 78559 | 2014.0 | 835 | LAKE COUNTY | 3.5560 | 09-27-2014 | OKAHUMPKA SWAMP | 2014-09-27 | 9.0 | 27.0 | 5.0 | Sat |
| 78675 | 2014.0 | 835 | LAKE COUNTY | 2.6924 | 09-27-2014 | OKAHUMPKA SWAMP | 2014-09-27 | 9.0 | 27.0 | 5.0 | Sat |
| 85658 | 2015.0 | 835 | LAKE COUNTY | 2.1336 | 10-17-2015 | GREEN SWAMP | 2015-10-17 | 10.0 | 17.0 | 5.0 | Sat |
| 85703 | 2015.0 | 835 | LAKE COUNTY | 1.7018 | 10-11-2015 | GREEN SWAMP | 2015-10-11 | 10.0 | 11.0 | 6.0 | Sun |
{i:filt_location_dict[i].sum() for i in filt_location_dict}
{'River': 4282,
 'Lake': 6234,
 'County': 132,
 'WMA': 34,
 'Marsh': 46,
 'Pond': 304,
 'Unknown': 1,
 'Swamp': 149,
 'Creek': 1544,
 'Canal': 573,
 'Springs': 44}
## Find anything which has a double count in location (e.g. Newmans lake will look like a 'wma' and a 'lake')
from itertools import combinations as cmb

overlap_locations = {c:(filt_location_dict[c[0]] & filt_location_dict[c[1]])
                     for c in cmb(filt_location_dict.keys(),2)}

overlap_locations_counts = {l:overlap_locations[l].sum() for l in overlap_locations if overlap_locations[l].sum()!=0}

overlap_locations_counts
{('River', 'Lake'): 19,
 ('River', 'County'): 9,
 ('River', 'Swamp'): 36,
 ('River', 'Creek'): 9,
 ('River', 'Canal'): 3,
 ('River', 'Springs'): 3,
 ('Lake', 'County'): 12,
 ('Lake', 'WMA'): 20,
 ('Lake', 'Marsh'): 12,
 ('Lake', 'Pond'): 7,
 ('Lake', 'Swamp'): 5,
 ('Lake', 'Creek'): 19,
 ('Lake', 'Canal'): 45,
 ('Lake', 'Springs'): 2,
 ('County', 'Pond'): 6,
 ('County', 'Creek'): 2,
 ('County', 'Canal'): 16,
 ('County', 'Springs'): 2,
 ('Pond', 'Swamp'): 1,
 ('Pond', 'Creek'): 12,
 ('Pond', 'Canal'): 19,
 ('Swamp', 'Creek'): 40,
 ('Creek', 'Canal'): 6,
 ('Creek', 'Springs'): 16}
overlap_locationsdata = {l:clean_data.Location[overlap_locations[l]].unique() for l in overlap_locations if overlap_locations[l].sum()!=0}

overlap_locationsdata
{('River',
  'Lake'): array(['ST JOHNS RIVER LAKE POINSETT', 'ST JOHNS RIVER LAKE WINDER',
        'ST. JOHNS RIVER (LAKE POINSETT)', 'LAKE HARNEY ST JOHNS RIVER',
        'LAKE HARNEY (ST. JOHNS RIVER)', 'ST HONS RIVER LAKE HARNEY',
        'KISS RIVER NORTH LAKE', 'SMOKEHOUSE LAKE/CHOCTACHATEE RIVER',
        'ST JOHNS RIVER/LAKE HELL N BLAZES',
        'ST JOHNS RIVER LAKE POINSETTE', 'ST JOHNS RIVER/LAKE HARNEY',
        'MANATEE RIVER/LAKE MANATEE EAST OF VERNA BETHANY R',
        'choctawhatchee river-- inside lake', 'LITTLE RIVER LAKE'],
       dtype=object),
 ('River',
  'County'): array(['CLAY COUNTY, ST. JOHNS RIVER', 'NORTH INDIAN RIVER COUNTY',
        'NASSAU COUNTY, ST MARYS RIVER', 'OKALOOSA COUNTY, YELLOW RIVER',
        'River/creek off of county rd 67',
        'Escambia River (santa rosa county side)',
        'escambia River (santa rosa county side)'], dtype=object),
 ('River', 'Swamp'): array(['SIMPSON RIVER, ESCAMBIA RIVER SWAMP',
        'WHITE RIVER, ESCAMBIA RIVER SWAMP', 'WITHLACOOCHEE RIVER SWAMP',
        'RIVER SWAMP'], dtype=object),
 ('River', 'Creek'): array(['St. Johns River Deep Creek',
        'JUST OFF APALACH. RIVER IN GRASSY CREEK',
        'SMOKEHOUSE CREEK-BROTHERS RIVER', 'ST. JOHNS RIVER, DEEP CREEK',
        'ST. JOHNS RIVER, TROUT CREEK', 'River/creek off of county rd 67',
        'St. Johns River north of deep creek',
        'Tocoi Creek off of St. Johns River'], dtype=object),
 ('River',
  'Canal'): array(['KISSIMMEE RIVER CANAL', 'ST JOHNS RIVER UPPER BASIN CANALS'],
       dtype=object),
 ('River',
  'Springs'): array(['Santa Fe River. High springs', 'LITTLE RIVER SPRINGS'],
       dtype=object),
 ('Lake', 'County'): array(['Lake County', 'lake county blue springs',
        'lake county blue springs area', 'Polk County Lake', 'LAKE COUNTY',
        'PRIVATE POND IN SOUTH LAKE COUNTY', 'PIVATE LAKE IN LEE COUNTY',
        'Lake county/ lake denham', 'Lake county / private land',
        'polk county private lake no name'], dtype=object),
 ('Lake', 'WMA'): array(['NEWMANS LAKE'], dtype=object),
 ('Lake',
  'Marsh'): array(['Lettuce Lake (Murphy Marsh)', 'LETTUCE LAKE (MURPHY MARSH)',
        'LETTUCE LAKE / MURPHY MARSH', 'MURPHY MARSH (LETTUCE LAKE)',
        'MURPHY MARSH/LETTUCE LAKE', 'LETTUCE LAKE(MURPHYMARSH)',
        'LAKE MATTIE MARSH'], dtype=object),
 ('Lake',
  'Pond'): array(['LEISURE LAKE POND', 'PRIVATE PROPERTY (POND) SR 70 LAKE PLACID',
        'PRIVATE POND IN SOUTH LAKE COUNTY', 'Private Pond Lakeland',
        'Private Pond LakeLand', 'POND ON MOORE RD LAKELAND',
        'BRACEY RD N LAKELAND POND'], dtype=object),
 ('Lake', 'Swamp'): array(['GAP LAKE SWAMP', 'SWAMP, LAKE'], dtype=object),
 ('Lake',
  'Creek'): array(['ECONFINA CREEK, DEERPOINT LAKE', 'LAKE MARION CREEK',
        'BLAKESLEE CREEK', 'LAKE BUTLER CREEK', 'LAKE ASHBY CREEK'],
       dtype=object),
 ('Lake', 'Canal'): array(['LAKE JUNE CANAL', 'INDAIN LAKE ESTATES CANAL',
        'RIM CANAL LAKE OKEECHOBEE', 'LAKE OKEECHOBEE RIM CANAL',
        'GASPRILLIA ROAD CANAL @HOLIDAY LAKES', 'LAKE GENTRY CANAL',
        'CANAL OFF LAKE CYPRESS', 'WEST LAKE CANAL',
        'WEST LAKE TOHO PRIVATE CANAL',
        'PRIVATE CANAL OFF OF WEST LAKE TOHO',
        'Canal adjacent to Lake Okeechobee', 'CANAL LAKE',
        'johns lake canal', 'Canal going from w lake toho to cypress lake',
        'canal that goes from w lake toho to cypress lake',
        'Lake cypress canals', 'Lake gentry canal', 'GANT LAKE CANAL',
        'LAKE ASHBY CANAL', 'LAKE TARPON CANAL'], dtype=object),
 ('Lake',
  'Springs'): array(['lake county blue springs', 'lake county blue springs area'],
       dtype=object),
 ('County', 'Pond'): array(['NE CORNER HOLMES COUNTY, BAXLEY POND',
        'PRIVATE POND IN SOUTH LAKE COUNTY',
        'private pond eastern Lafayette County',
        'Washington County / Private Property Pond HWY 77',
        'Back Waters of Gap Pond hwy 77 Washington County'], dtype=object),
 ('County', 'Creek'): array(['River/creek off of county rd 67',
        'creek of of county rd 67 in franklin county'], dtype=object),
 ('County',
  'Canal'): array(['Canals off of interceptor lagoon Charlotte county',
        'GULF COUNTY CANAL', 'COUNTY LINE CANAL'], dtype=object),
 ('County',
  'Springs'): array(['lake county blue springs', 'lake county blue springs area'],
       dtype=object),
 ('Pond', 'Swamp'): array(['Swamp Pond'], dtype=object),
 ('Pond', 'Creek'): array(['SWIFT CREEK POND'], dtype=object),
 ('Pond',
  'Canal'): array(['Harney Pond Canal', 'Harne Pond Canal', 'Hawney Pond Canal',
        'HARNEY POND CANAL', 'Near harney pond canal'], dtype=object),
 ('Swamp',
  'Creek'): array(['REEDY CREEK SWAMP', 'RICE CREEK SWAMP'], dtype=object),
 ('Creek', 'Canal'): array(['FIRST EATEN CREEK CANAL', 'TAYLOR CREEK CANAL',
        'CANOE CREEK CANAL'], dtype=object),
 ('Creek', 'Springs'): array(['ALEXANDER SPRINGS CREEK'], dtype=object)}
## Find anything which has a double count in Area (e.g. Newmans lake)

overlap_area = {c:(filt_area_dict[c[0]] & filt_area_dict[c[1]])
                     for c in cmb(filt_area_dict.keys(),2)}

overlap_area_counts = {l:overlap_area[l].sum() for l in overlap_area if overlap_area[l].sum()!=0}

overlap_area_counts
{('River', 'Lake'): 9763,
 ('River', 'County'): 39,
 ('River', 'WMA'): 153,
 ('Lake', 'County'): 2466,
 ('Lake', 'WMA'): 176}
overlap_areadata = {l:clean_data['Area Name'][overlap_area[l]].unique() for l in overlap_area if overlap_area[l].sum()!=0}

overlap_areadata
{('River', 'Lake'): array(["ST. JOHNS RIVER (LAKE HELL N' BLAZES)",
        'ST. JOHNS RIVER (LAKE POINSETT)', 'ST. JOHNS RIVER (PUZZLE LAKE)'],
       dtype=object),
 ('River', 'County'): array(['INDIAN RIVER COUNTY'], dtype=object),
 ('River', 'WMA'): array(['GUANA RIVER WMA'], dtype=object),
 ('Lake', 'County'): array(['LAKE COUNTY'], dtype=object),
 ('Lake', 'WMA'): array(['THREE LAKES WMA'], dtype=object)}
This counting thing is never going to be 100% correct, unless we went through and relabelled these by hand. We’re not going to do that, so we’ll make clear a few sensible rules that we’re following to do the counting:
1. Prioritise the Location before the Area
2. Dealing with Double labelled Locations
- If it’s a county, use the other label</li>
- If it’s a lake and a river, call it a lake</li>
- If it’s a lake and a WMA, it’s a lake</li>
- If it’s labelled as a creek, pond, canal, swamp or marsh and something else, ignore the other thing.
3. Dealing with double labelled Areas
- If it’s a county, use the other label
- If it’s a lake and a river, it’s a lake
- If it’s a WMA and something else, ignore the other thing
4. Where there are different labels across the Area and Location, take the Location
5. If you still can’t classify it, it’s just somewhere in the county. Hollows, pools, ditches or 2 miles down from Eureka, them gators get everywhere!
This counting thing is never going to be 100% correct, unless we went through and relabelled these by hand.
We're not going to do that, so we'll make clear a few sensible rules that we're following to do the counting:
1. Prioritise the Location before the Area
2. Dealing with Double labelled Locations
- If it's a county, use the other label
- If it's a lake and a river, call it a lake
- If it's a lake and a WMA, it's a lake
- If it's labelled as a creek, pond, canal, swamp or marsh and something else, ignore the other thing.
3. Dealing with double labelled Areas
- If it's a county, use the other label
- If it's a lake and a river, it's a lake
- If it's a WMA and something else, ignore the other thing
4. Where there are different labels across the Area and Location, take the Location
5. If you still can't classify it, it's just somewhere in the county. Hollows, pools, ditches or 2 miles down from Eureka, them gators get everywhere!
conditions = [
    filt_location_dict['Creek'],
    filt_location_dict['Canal'],
    filt_location_dict['Springs'],
    filt_location_dict['Pond'],
    filt_location_dict['Swamp'],
    filt_location_dict['Marsh'],
    filt_location_dict['Lake'],
    filt_location_dict['River'],
    filt_location_dict['WMA'],
    filt_area_dict['WMA'],
    filt_area_dict['^STA'],
    filt_area_dict['Marsh'],
    filt_area_dict['Reservoir'],
    (filt_area_dict['Lake']) & (filt_area_dict['County']),
    (filt_area_dict['River']) & (filt_area_dict['County']),
    filt_area_dict['Lake'],
    filt_area_dict['River'],
    filt_area_dict['County']]

choices = ['Creek','Canal','Springs','Pond', 'Swamp', 'Marsh','Lake','River','WMA','WMA','STA','Marsh','Reservoir','County','County','Lake','River','County']

clean_data['geography'] = np.select(conditions, choices, default='Unknown')
clean_data[clean_data['geography'] == 'Unknown']['Carcass Size'].count()
463
### So we've got about 0.5% carcasses with no geography

clean_data[clean_data['geography'] == 'Unknown'].groupby(['Area Number','Area Name'])['Carcass Size'].count().sort_values(ascending = False)
Area Number  Area Name
542          BLUE CYPRESS WATER MANAGEMENT AREA        340
112          TENEROC FMA                                39
401          A.R.M. LOXAHATCHEE NWR                     36
546          T.M. GOODWIN WATERFOWL MANAGEMENT AREA     29
112          TENOROC FMA                                15
839          LIBERTY                                     2
819          FRANKLIN                                    2
Name: Carcass Size, dtype: int64
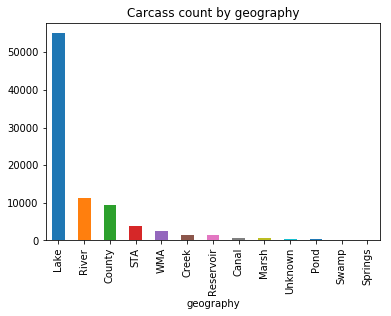
clean_data.groupby('geography')['Carcass Size'].count().sort_values(ascending = False).plot(kind = 'bar',
                                                                                            title = 'Carcass count by geography')
<matplotlib.axes._subplots.AxesSubplot at 0x7f38e83cfac8>
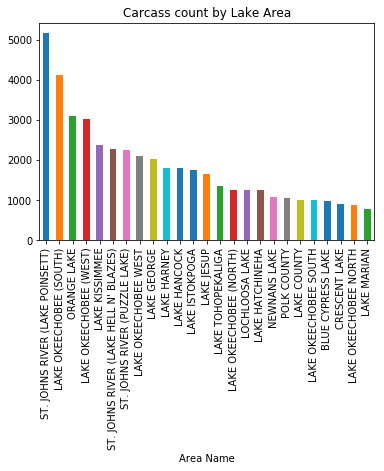
clean_data[clean_data['geography'] == 'Lake'].groupby('Area Name')['Carcass Size'
                                            ].count().sort_values(ascending = False)[:25].plot(kind = 'bar',
                                                                                    title = 'Carcass count by Lake Area')
<matplotlib.axes._subplots.AxesSubplot at 0x7f38e3600a58>
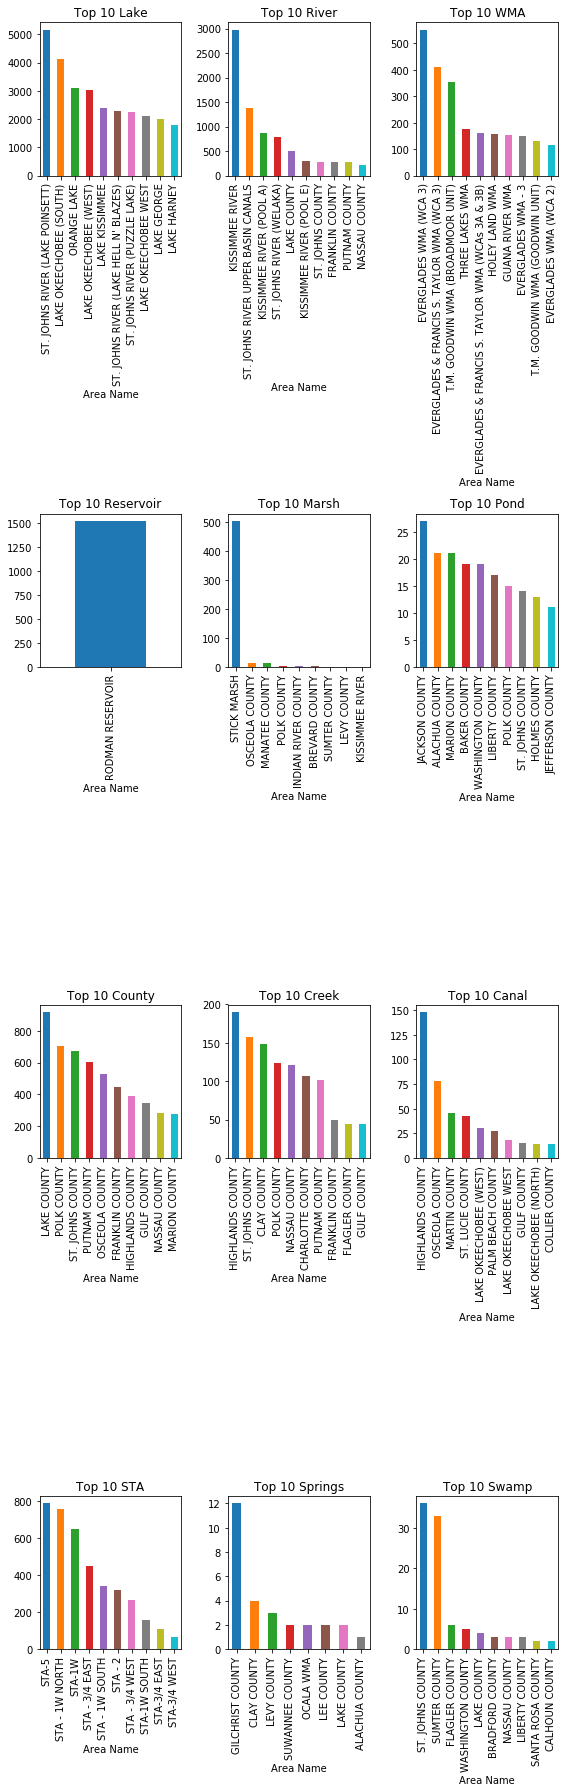
fig, ((ax1,ax2,ax3),(ax4,ax5,ax6),(ax7,ax8,ax9),(ax10,ax11,ax12)) = plt.subplots(4,3,figsize = (8,25))
axes = [ax1,ax2,ax3,ax4,ax5,ax6,ax7,ax8,ax9,ax10,ax11,ax12]

geography_names = list(clean_data['geography'].unique())

geography_names.remove('Unknown')

for i, area in enumerate(geography_names):
    try:
        d = clean_data[clean_data.geography == area].groupby(['Area Name'])['Carcass Size'
                                ].count().sort_values(ascending = False)
        if len(d) > 10:
            d[:10].plot(ax = axes[i],kind = 'bar', title = 'Top 10 %s' %area)

        else:
            d.plot(ax = axes[i],kind = 'bar', title = 'Top 10 %s' %area)
    except:
        pass


plt.tight_layout()
plt.show()
Range of sizes
#average size over time
#range of sizes vs geography
#range of sizes vs top locations
## first off, identify any lines where the Carcass Size is 0

zero_size = clean_data[clean_data['Carcass Size']==0].index

## fill these missing data points with the average Carcass Size

clean_data.loc[zero_size,'Carcass Size'] = clean_data[clean_data['Carcass Size']!=0]['Carcass Size'].mean()
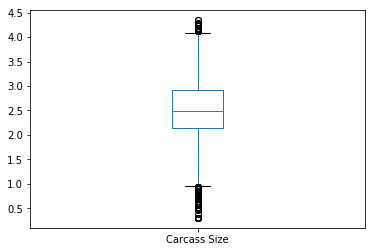
clean_data['Carcass Size'].plot(kind='box')
<matplotlib.axes._subplots.AxesSubplot at 0x7f38e35bef28>
## Identify the biggest catches ever

clean_data[clean_data['Carcass Size'] == clean_data['Carcass Size'].max()]
| Year | Area Number | Area Name | Carcass Size | Harvest Date | Location | Harvest_Date | Month | Day | DayofWeek | Dayname | geography | |
|---|---|---|---|---|---|---|---|---|---|---|---|---|
| 44996 | 2010.0 | 502 | ST. JOHNS RIVER (LAKE POINSETT) | 4.3434 | 10-31-2010 | NaN | 2010-10-31 | 10.0 | 31.0 | 6.0 | Sun | Lake |
| 78315 | 2014.0 | 828 | HIGHLANDS COUNTY | 4.3434 | 10-28-2014 | LITTLE RED WATER LAKE | 2014-10-28 | 10.0 | 28.0 | 1.0 | Tue | Lake |
## Which locations have the most 4m (14 feet) or greater alligators?

clean_data[clean_data['Carcass Size'] >= 4].groupby(['Area Name'])['Carcass Size'].count().sort_values(ascending = False)[:10]
Area Name
LAKE GEORGE               10
PUTNAM COUNTY              8
LAKE JESUP                 5
LAKE TOHOPEKALIGA          5
LAKE COUNTY                5
HIGHLANDS COUNTY           5
CRESCENT LAKE              4
LAKE OKEECHOBEE (WEST)     4
LAKE GRIFFIN               3
KISSIMMEE RIVER            3
Name: Carcass Size, dtype: int64
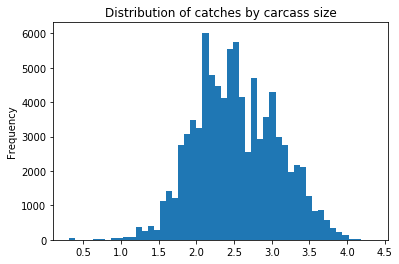
clean_data['Carcass Size'].plot(kind='hist',bins = 50, title = 'Distribution of catches by carcass size')
<matplotlib.axes._subplots.AxesSubplot at 0x7f38e2849080>
df_by_year['Carcass Size'].mean().plot(title = 'Carcass Size by month')
<matplotlib.axes._subplots.AxesSubplot at 0x7f38e27a6c50>
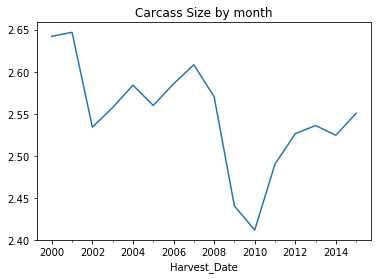
Interesting to note the dip in size around 2010.
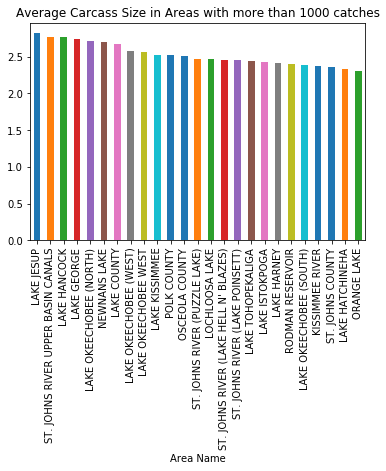
clean_data.groupby(['Area Name']).filter(lambda x: x['Carcass Size'].count() > 1000
                                        ).groupby(['Area Name'])['Carcass Size'].mean(
                                        ).sort_values(ascending = False).plot(kind='bar', title='Average Carcass Size in Areas with more than 1000 catches')
<matplotlib.axes._subplots.AxesSubplot at 0x7f38e2288400>
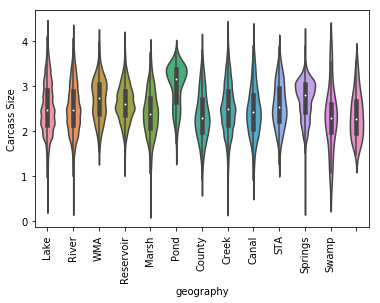
plot = sns.violinplot(x = clean_data['geography'], y = clean_data['Carcass Size'])

plot.set_xticklabels(labels = geography_names,rotation = 90)

plt.show()
What about if I want to look for some smaller Alligators to get my eye in first?
clean_data.groupby(['Area Name'])['Carcass Size'].agg({'average size': 'mean'}).sort_values(by='average size',ascending = True)[:10]
/home/tms/anaconda3/lib/python3.7/site-packages/ipykernel_launcher.py:1: FutureWarning: using a dict on a Series for aggregation
is deprecated and will be removed in a future version
  """Entry point for launching an IPython kernel.
| average size | |
|---|---|
| Area Name | |
| BRADFORD COUNTY | 2.168309 |
| FRANKLIN | 2.171700 |
| BAKER COUNTY | 2.225239 |
| UNION COUNTY | 2.236519 |
| LAKE ROUSSEAU | 2.245573 |
| SUWANNEE COUNTY | 2.249251 |
| OKALOOSA COUNTY | 2.251529 |
| PEACE RIVER NORTH | 2.257245 |
| WASHINGTON COUNTY | 2.275885 |
| SANTA ROSA COUNTY | 2.288073 |
print(clean_data['Carcass Size'].min())

clean_data[clean_data['Carcass Size'] <= 1].groupby(['Area Name']
                            )['Carcass Size'].agg({'Number of catches less than 1m':'count'}
                            ).sort_values(by='Number of catches less than 1m',ascending = False)[:10]
0.3048


/home/tms/anaconda3/lib/python3.7/site-packages/ipykernel_launcher.py:4: FutureWarning: using a dict on a Series for aggregation
is deprecated and will be removed in a future version
  after removing the cwd from sys.path.
| Number of catches less than 1m | |
|---|---|
| Area Name | |
| ORANGE LAKE | 23 |
| KISSIMMEE RIVER | 11 |
| ST. JOHNS RIVER (PUZZLE LAKE) | 10 |
| LAKE OKEECHOBEE (SOUTH) | 10 |
| LAKE HARNEY | 9 |
| LOCHLOOSA LAKE | 9 |
| LAKE TOHOPEKALIGA | 7 |
| LAKE OKEECHOBEE (WEST) | 6 |
| LAKE HATCHINEHA | 6 |
| POLK COUNTY | 6 |
So, if you're looking for some big gators, get down to Lake Jesup (biggest average catch) or Lake George (most catches above 4m), and if you want something smaller to start off with, get to Bradford County (smallest average catch) or Orange Lake (largest number of catches less than 1m)
Awwww, SNAP… That’s all we’ve got time for. Catch ya!
Tom Merritt Smith 2017 Get in touch: tmerrittsmith (at) gmail (dot) com
Postscript: March, 2019
A few things I would do next time:
- map some of this stuff
- consider something like vega/altair to make interactive plots