Game Of Life On Images
Conway’s Game of Life on images, using python
I remember playing the game of life program on Windows 95, and thinking “This isn’t a game?!” Years later, and this zero-player game is in my all-time geek hall of fame. If you’re not familiar, Life takes place on a 2d grid. At step zero, cells on the grid are determined as living or dead. In each subsequent step, new cells are defined as alive if they have 2 or 3 living neighbours, and dead if they have more or less than this. What’s amazing is that taking only two rules, endless possibilities emerge. If you haven’t seen Life in Life, do it now!… SOOO META!!!
A few years back, I saw this neat little post on Hacker News showing an application of Life to images. It was in Java, so I tried to reimplement it in python. So here it is. Conway’s Game of Life on images. And if you get to the end, there’s another Meta moment… Conway’s Game of Life on Conway’s face!
Note: To keep the filesize down, I haven’t generated many frames of the animations here, but the code is ready and waiting.
from matplotlib import rc
from IPython.display import HTML
from matplotlib import animation
import matplotlib.pyplot as plt
import numpy as np
%matplotlib inline
## this line usually comes with a health warning, but in this case supresses an annoying deprecation
## warning whose solution doesn't add up. See release notes to numpy 1.15 regarding sums of generators
np.warnings.filterwarnings('ignore')
### Game of Life implementation from
## https://jakevdp.github.io/blog/2013/08/07/conways-game-of-life/
def life_step(X):
"""Game of life step using generator expressions"""
nbrs_count = sum(np.roll(np.roll(X, i, 0), j, 1)
for i in (-1, 0, 1) for j in (-1, 0, 1)
if (i != 0 or j != 0))
return (nbrs_count == 3) | (X & (nbrs_count == 2))
### Animating the Game of Life (from jakevdp)
from matplotlib import animation
def life_animation(X, figsize=(5,5), frames=10, interval=300, mode='loop'):
"""Produce a Game of Life Animation
Parameters
----------
X : array_like
a two-dimensional numpy array showing the game board
dpi : integer
the number of dots per inch in the resulting animation.
This controls the size of the game board on the screen
frames : integer
The number of frames to compute for the animation
interval : float
The time interval (in milliseconds) between frames
mode : string
The default mode of the animation. Options are ['loop'|'once'|'reflect']
"""
X = np.asarray(X)
assert X.ndim == 2
X = X.astype(bool)
X_blank = np.zeros_like(X)
# figsize = (X.shape[1] * 1. / dpi, X.shape[0] * 1. / dpi)
fig = plt.figure(figsize=figsize)
ax = fig.add_axes([0, 0, 1, 1], xticks=[], yticks=[], frameon=False)
im = ax.imshow(X, cmap=plt.cm.binary, interpolation='nearest')
im.set_clim(-0.05, 1) # Make background gray
# initialization function: plot the background of each frame
def init():
im.set_data(X_blank)
return (im,)
# animation function. This is called sequentially
def animate(i):
im.set_data(animate.X)
animate.X = life_step(animate.X)
return (im,)
animate.X = X
anim = animation.FuncAnimation(fig, animate, init_func=init,
frames=frames, interval=interval)
return anim
np.random.seed(0)
X = np.zeros((30, 40), dtype=bool)
r = np.random.random((10, 20))
X[10:20, 10:30] = (r > 0.75)
anim = life_animation(X, frames=40, mode='once')
plt.close() ## No matter what I tried, unless I add this line in I get an extra phantom canvas appearing!
HTML(anim.to_jshtml())
</input>
## Starting with a straight line
np.random.seed(0)
X = np.zeros((60, 61), dtype=bool)
X[30, 10:52] = 1
anim = life_animation(X, frames=10, mode='once')
plt.close()
HTML(anim.to_jshtml())
</input>
How about we try some more interesting patterns, care of the amazing conwaylife.com
import requests
max_url = 'http://www.conwaylife.com/patterns/max.cells'
r = requests.get(max_url)
max_pattern = r.text.split('\r\n')[4:-1]
max_pattern
['..................O',
'.................OOO',
'............OOO....OO',
'...........O..OOO..O.OO',
'..........O...O.O..O.O',
'..........O....O.O.O.O.OO',
'............O....O.O...OO',
'OOOO.....O.O....O...O.OOO',
'O...OO.O.OOO.OO.........OO',
'O.....OO.....O',
'.O..OO.O..O..O.OO',
'.......O.O.O.O.O.O.....OOOO',
'.O..OO.O..O..O..OO.O.OO...O',
'O.....OO...O.O.O...OO.....O',
'O...OO.O.OO..O..O..O.OO..O',
'OOOO.....O.O.O.O.O.O',
'..........OO.O..O..O.OO..O',
'.............O.....OO.....O',
'.OO.........OO.OOO.O.OO...O',
'..OOO.O...O....O.O.....OOOO',
'..OO...O.O....O',
'..OO.O.O.O.O....O',
'.....O.O..O.O...O',
'....OO.O..OOO..O',
'......OO....OOO',
'.......OOO',
'........O']
def text_to_life(text_pattern):
pattern = []
max_width = 0
for line in text_pattern:
row = []
for position in line:
if position == '.':
row.append(False)
else:
row.append(True)
# Establish the maximum width of the array
if len(row) > max_width:
max_width = len(row)
pattern.append(row)
# Pad out any shorter rows back to the max length
for row in pattern:
if len(row) < max_width:
pad_length = max_width - len(row)
row += [0] * (pad_length)
pattern = np.array(pattern)
return pattern
max_pattern_array = text_to_life(max_pattern)
Max filler is SO cool! It seems to cover the plane in an almost pinstripe pattern, but because we’re using a wrap function when the life hits the edge of the canvas the pattern kind of peaks and then falls back into the kind of entropy that we’ve all come to expect at the heat death of our ever expanding universe…!
np.random.seed(0)
X = np.zeros((500, 500), dtype=bool)
X[200:227, 200:227] = max_pattern_array
anim = life_animation(X, frames=50, mode='once', interval=100)
plt.close()
HTML(anim.to_jshtml())
</input>
Time to try it on images
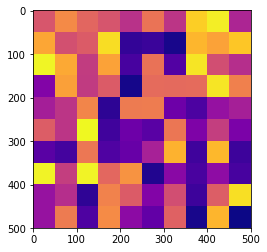
Following the original inspiration from zx, we’ll kick things off with a grid of colours.
def colour_grid(size, density):
'''
docstring
'''
data = np.random.random(size)
grid = np.zeros([s * density for s in size])
# fill out each square in the grid with the same colour, but a finer density
# to enable the life cells to be more graduated
for x_square in range(size[0]):
for y_square in range(size[1]):
local_x = density * x_square
local_y = density * y_square
for x in range(local_x, local_x + density):
for y in range(local_y, local_y + density):
grid[x, y] = data[x_square, y_square]
return grid
plt.imshow(colour_grid((10,10),50), cmap='plasma')
<matplotlib.image.AxesImage at 0x7f3eb9556128>
size = (10,10)
density = 10
start_image = colour_grid(size, density)
# set which cells are alive at step 0
start_grid = start_image > 0.7
# set the behaviour for the life_effect
wrap = size[0] * density
# set the number of frames you want
frames = 100
def life_effect(image, step, wrap):
'''
docstring
'''
x_cells, y_cells = np.where(step)
new_cells = np.mod(x_cells[0] -1, wrap)
image[step] = image[new_cells, y_cells]
return image
def data_gen():
cnt = 0
step = start_grid
image = start_image
while cnt < frames:
cnt+=1
if cnt > 1:
step = life_step(step)
image = life_effect(image, step, wrap)
yield step, image
fig, (ax1, ax2) = plt.subplots(1,2,figsize=(10,10))
plt.tight_layout()
# intialize image objects (one in each axes)
img = ax1.imshow(start_image, cmap='plasma')
life = ax2.imshow(start_grid, cmap='plasma')
images = [img, life]
def run(data):
# update the data
step, image = data
# update the images with the new data
images[0].set_data(step)
images[1].set_data(image)
return images
ani = animation.FuncAnimation(fig, run, data_gen, blit=True, interval=300,
repeat=False)
plt.close()
HTML(ani.to_jshtml())
</input>
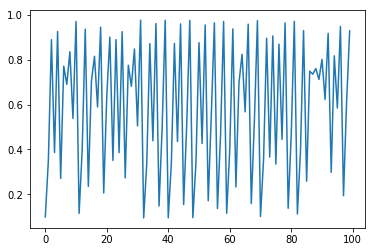
This time, let’s use the max_filler pattern kick things off, and change the life effect function. Instead of drawing the colour from one of our neighbours, we’ll just flick the colour somehow. What better way than the old favourite \(rx(1 - x)\), which displays chaotic behaviour when r is between 3 and 4.
def life_effect(x, r):
return r * x * (1 - x)
life_effect = np.vectorize(life_effect)
r = 3.9
sequence = [0.1]
for i in range(99):
sequence.append(life_effect(sequence[-1], r))
plt.plot(np.arange(100), sequence)
[<matplotlib.lines.Line2D at 0x7f3eb93b8780>]
np.shape(life_effect(start_image, r))
(100, 100)
size = (10,10)
density = 10
start_image = colour_grid(size, density)
# set which cells are alive at step 0
start_grid = np.zeros((size[0] * density, size[1] * density), dtype='bool')
start_grid[36:63, 36:63] = max_pattern_array
# set the 'chaos factor' for the life_step
r = 3.5
# set the behaviour for the life_effect
wrap = size[0] * density
# set the number of frames you want
frames = 1000
def data_gen():
cnt = 0
step = start_grid
image = start_image
while cnt < frames:
cnt+=1
if cnt > 1:
step = life_step(step)
image[step] = life_effect(image[step], r)
yield step, image
fig, (ax1, ax2) = plt.subplots(1,2,figsize=(10,10))
plt.tight_layout()
# intialize image objects (one in each axes)
img = ax1.imshow(start_image)
life = ax2.imshow(start_grid)
images = [img, life]
def run(data):
# update the data
step, image = data
# update the images with the new data
images[0].set_data(step)
images[1].set_data(image)
return images
ani = animation.FuncAnimation(fig, run, data_gen, blit=True, interval=10,
repeat=False)
plt.close()
HTML(ani.to_jshtml())
</input>
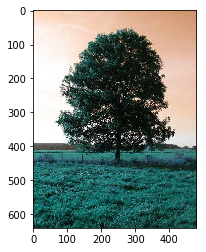
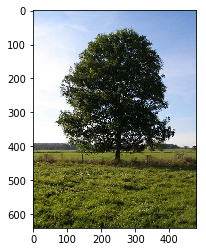
Working with photos
Matplotlib did the job for me, although in a previous version of this I’d used opencv.
import matplotlib.pyplot as plt
import matplotlib.image as mpimg
image = mpimg.imread("tree.jpg")
plt.imshow(image)
plt.show()

Interestingly, if you do go down the road of opencv, it seems to reverse the colours in the rgb matrix… so plt.imshow(image) interprets it as a …bgr matrix. Anyway, I digress!
import cv2
tree = cv2.imread("tree.jpg")
plt.imshow(tree, aspect='equal')
<matplotlib.image.AxesImage at 0x7f3eb80f55c0>
red = tree[:,:,0]
green = tree[:,:,1]
blue = tree[:,:,2]
plt.imshow(np.dstack([blue, green, red]))
<matplotlib.image.AxesImage at 0x7f3eb804ada0>
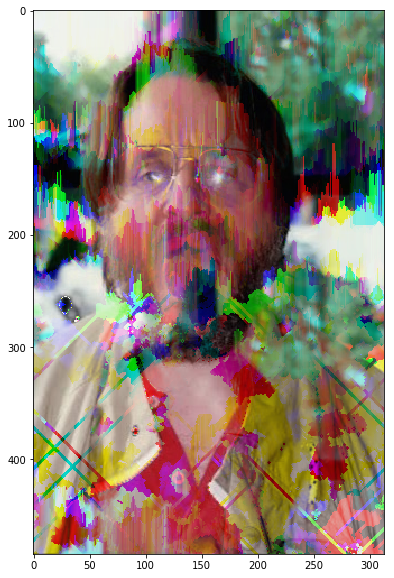
We’ll apply life to each of the RGB layers, and then join in the results
Views vs copies
At this point, it’s important to cast your eye over views and copies of numpy arrays. They’re different, and they’re tricky. I found this pretty helpful.
red = np.copy(image[:,:,0])
green = np.copy(image[:,:,1])
blue = np.copy(image[:,:,2])
plt.imshow(np.dstack([red, green, blue]))
<matplotlib.image.AxesImage at 0x7f3eb0035668>

# check we've done our copying correctly
# If we have, this should not return anything!
red.base
# Determine which cells are alive at the initial point
red_step = red < 130
green_step = green < 130
blue_step = blue < 130
temp_red = np.copy(red)
temp_green = np.copy(green)
temp_blue = np.copy(blue)
images = [image]
for i in range(100):
red_step = life_step(red_step)
green_step = life_step(green_step)
blue_step = life_step(blue_step)
red[red_step] = red[np.mod(np.where(red_step)[0] + 1,255),np.where(red_step)[1]]
green[green_step] = green[np.mod(np.where(green_step)[0] + 1,255),np.where(green_step)[1]]
blue[blue_step] = blue[np.mod(np.where(blue_step)[0] + 1,255),np.where(blue_step)[1]]
update = np.dstack([np.copy(colour) for colour in [red, green, blue]])
images.append(update)
fig = plt.figure(figsize=(6,6))
ims = [[plt.imshow(triplet,animated=True)] for triplet in images]
ani = animation.ArtistAnimation(fig, ims, interval=50,
blit=True, repeat_delay=1000)
plt.close()
HTML(ani.to_jshtml())
Animation size has reached 21109840 bytes, exceeding the limit of 20971520.0. If you're sure you want a larger animation embedded, set the animation.embed_limit rc parameter to a larger value (in MB). This and further frames will be dropped.
</input>